Best Practices for Measuring & Tracking Customer Engagement Metrics in 2023
Numbers never lie, and businesses that make decisions based on metrics never go wrong. Whether you have an ecommerce store, a digital marketing agency or a SaaS product you need to identify if your customers are happy or satisfied or not. Customer satisfaction is the key to improving sales and scaling revenues.
So, how do you measure customer satisfaction & engagement rates and track them over time? Identify results using the metrics. As we approach 2023, it’s more important than ever to stay on top of the latest best practices for measuring and tracking customer engagement metrics.
Different Businesses need Different Metrics
Not every business uses the customer satisfaction with the same metrics. Based on the nature of their business, the target audience, and product they need a different approach to measure customer engagement rates.
For example, a restaurant might measure the number of visits of each individual each month, while a business that supplies bottled water will measure the number of order per day. So, there is a difference in how companies measure metrics.
In this article, we will explore the most effective and up-to-date best metrics for measuring and tracking customer engagement rates in 2023.
Let’s get started!
The Net Promoter Score (NPS)
NPS allows you to measure customer loyalty and advocacy for a company or brand. It is based on a single question survey, where customers are asked to rate their likelihood of recommending a company’s product or service to others on a scale from 0 to 10.
The scores are categorized into three groups:
- Promoters (9-10): Customers who are highly satisfied and likely to recommend the company to others.
- Passives (7-8): The score shows customers who are satisfied with the company but not necessarily enthusiastic about recommending it to others.
- Detractors (0-6): Customers who are dissatisfied with the company and unlikely to recommend it to others.
For example, if a company surveyed 100 customers and found that 50 of them were promoters, 40 were passives, and 10 were detractors, the NPS would be calculated as follows:
NPS = (50 – 10) / 100 = 40%
A NPS of 40% would indicate that the company has a relatively positive reputation among its customers and that it is effectively engaging with them to build loyalty and advocacy.
Customer Acquisition Cost (CAC)
CAC is a crucial metric that measures the amount of money spent by a company to acquire a new customer. By analyzing the CAC, the company can assess the effectiveness of its marketing strategies. It also helps optimize them to reduce the cost of acquiring new customers and increase the return on investment (ROI).
Customer Acquisition Cost Includes:
- Cost of trading
- Advertisements cost
- Innovation cost
- Technical, publishing, promoting, and publishing cost
- Cost of marketing and sales process(team)
- Inventory cost
You can calculate the metric using the below formula.
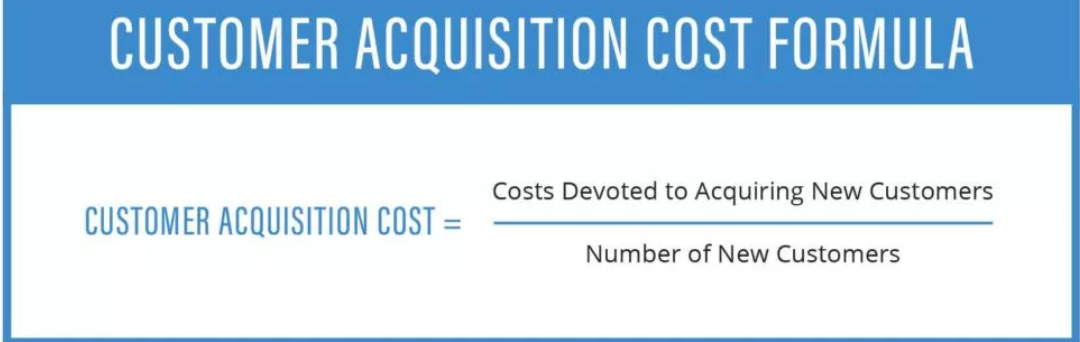
Source: patriotsoftware
Customer Satisfaction Score (CSAT)
This metric is used for a specific process. CSAT is a metric used when a company sends a survey to its customers after they have interacted with the company in some way (e.g. after making a purchase, receiving support, etc.).
The survey asks the customer to rate their overall satisfaction with the experience on a scale of 1 to 10. The scores are then collected and aggregated to calculate the overall CSAT score for the company.
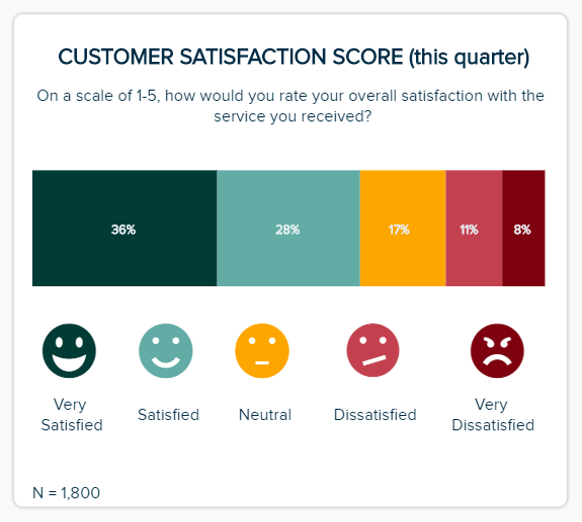
Source: datapine
Customer Effort Score (CES)
CES measures the level of difficulty a customer experiences when interacting with a company. It provides insights into how easy or difficult it is for customers to get the help they need and how much effort they need to put in to solve their problem.
Here’s how you can calculate it,
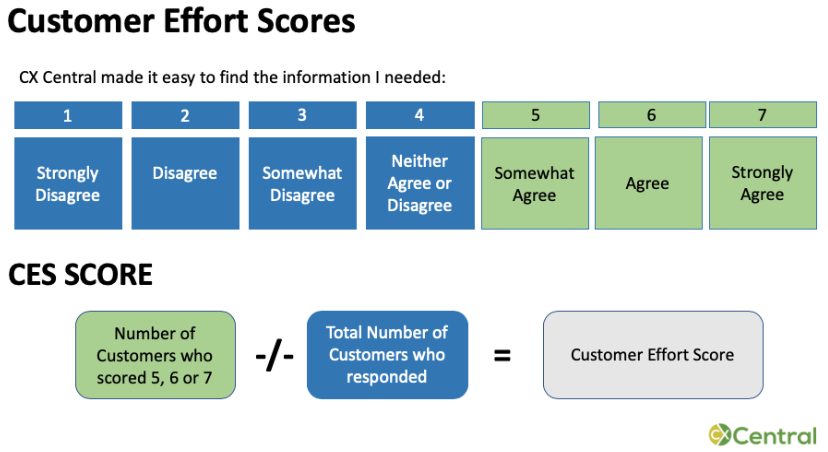
Source:cxcentral
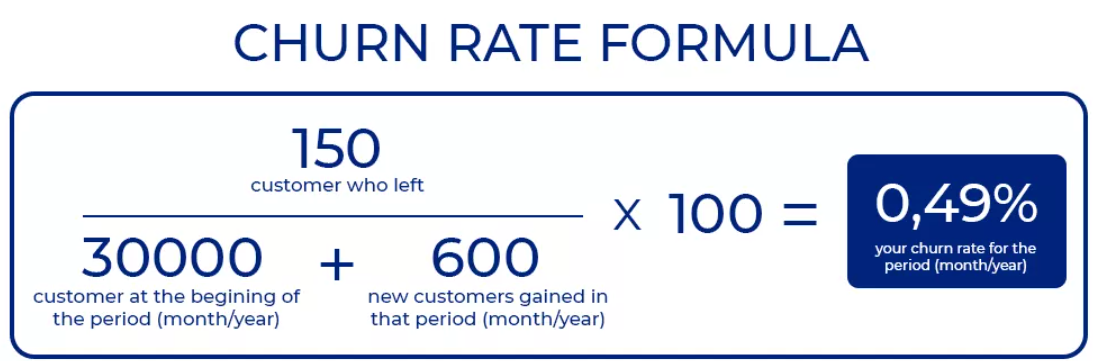
Churn Rate
Churn rate measures the number of customers who stop using a company’s product or service within a given time period by the number of customers at the beginning multiplied by 100%.
- It identifies areas of the business that need improvement in terms of customer satisfaction, product quality, or customer service.
- High churn rates are expensive and can lead to lost revenue, while low churn rates can be a sign of customer loyalty and business success.
- Understanding churn rate can also help businesses develop targeted retention strategies to reduce customer attrition and increase long-term revenue.
As a result, a lower churn rate is always beneficial to the growth of a company. A study by Bain & Company found that a 5% improvement in customer retention can lead to a 25-95%(from hbr) increase in profits.
User Actions
User actions are a useful customer engagement metric as they give insights into how users interact with a brand’s product or service.
For example, the number of clicks, views, and shares on a social media post can help brands understand which content is resonating with their audience.
- It can also indicate whether a brand’s website or app is user-friendly or if there are any technical glitches.
- By tracking user actions, brands can identify patterns and trends that can inform their marketing and customer engagement strategies.
- It helps brands identify loyal customers who engage frequently and reward them with incentives or exclusive offers.
Activity Time
Activity Time measures how much time a customer spends interacting with your brand or product, providing insight into their level of engagement and interest.
- It identifies trends in customer behavior, such as which features or content are most popular, and which areas may need improvement.
- By tracking activity time over time, you can gauge the effectiveness of marketing campaigns or changes to your product or service.
- Activity time can be used to segment customers and personalize messaging or offers based on their level of engagement.
Conversion Rate
Conversion rate is a useful customer engagement metric to understand because it provides insights into the effectiveness of marketing and sales efforts.
Specifically, it measures the percentage of website visitors who take a desired action, includes:
- Making a purchase
- Filling out a form
- Subscribing to a newsletter
Here’s how you can calculate conversion rate:
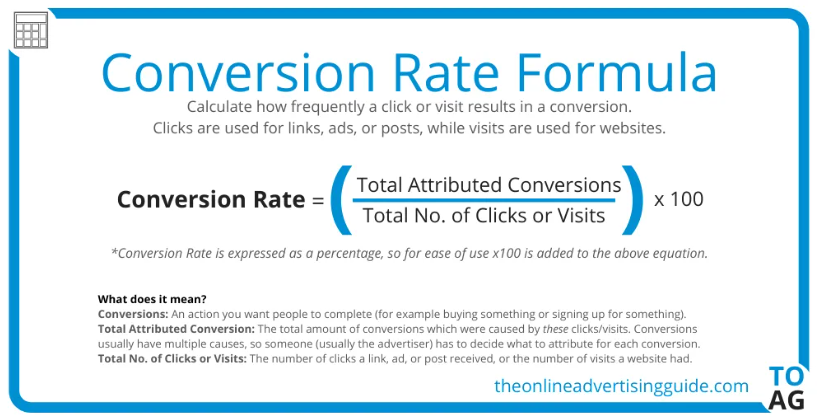
Source: theonlineadvertisingguide
Bounce Rate
Bounce rate measures the percentage of visitors who leave a website after only viewing one page, indicating a lack of interest or engagement with the content.
- It indicates issues with website design, content quality, or user experience, providing insights into areas that need improvement.
- It identifies specific pages or content that are driving visitors away, allowing for targeted improvements to boost engagement.
- Lowering bounce rate can lead to increased conversion rates, as visitors are more likely to take desired actions such as making a purchase or filling out a form when they engage with the website.
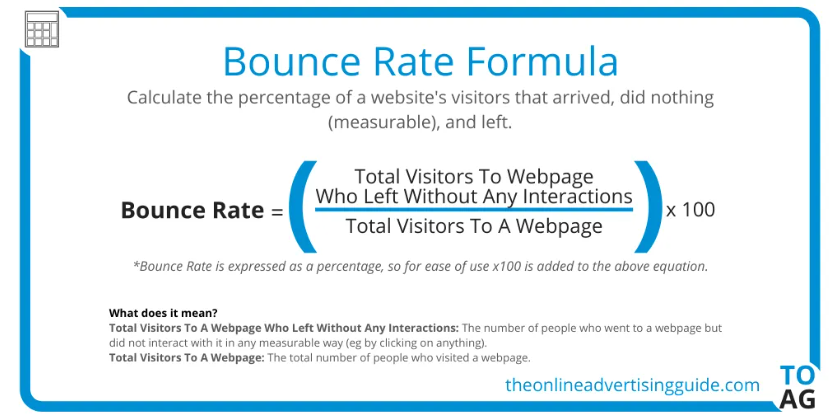
Source: theonlineadvertisingguide
Page Visit Frequency
Page visit frequency measures the number of times a customer visits a specific page or set of pages on a website within a specific time frame.
- It measures how often a customer visits a particular web page, indicating their level of interest in the content or offerings on that page.
- By analyzing page visit frequency, businesses can identify popular pages and optimize their content or offerings to better meet customer needs and preferences.
Service Accessibility Metrics
Service accessibility metrics measure how easy it is for customers to access a company’s products or services, which is a key factor in customer engagement and satisfaction.
- It identifies and addresses barriers that prevent customers from accessing their products or services, such as long wait times, confusing website navigation, or limited customer support options.
- It increases customer satisfaction and loyalty, reduces customer churn, and ultimately drives revenue growth.
For example, a company might track its average wait time for customer service calls, the percentage of website visitors who leave without making a purchase, or the number of customers who abandon their online shopping carts before completing a transaction.
Service Quality and Voice of Customer (VoC) Metrics
Service quality metrics measure the overall effectiveness and efficiency of a company’s service delivery, while VoC metrics focus on the customer’s perspective and feedback.
- Service Quality Metrics can help increase customer satisfaction and loyalty and might be used to benchmark against competitors
Example: A hotel chain measures service quality by conducting regular guest satisfaction surveys to gather feedback using a QR Code Generator online on cleanliness, staff friendliness, and overall experience. The hotel chain uses the survey results to identify areas of improvement and implement changes to increase customer satisfaction.
- Voice of Customer Metrics provides insights into customer behavior and preferences. It can also be used to tailor products and services to better meet customer needs
Example: An e-commerce company gathers VoC metrics by analyzing customer reviews and feedback. By understanding the needs and preferences of their customers, the e-commerce company can improve its product offerings and provide better customer service, leading to increased customer loyalty and retention.
Staff Empowerment and Connection Metrics
Staff Empowerment Metrics shows how well staff are trained and equipped to handle customer needs.
- It indicates how empowered employees feel to go above and beyond for customers.
- This can lead to higher customer satisfaction and loyalty.
Example: A hotel measures staff empowerment by tracking how often employees are able to resolve complaints without needing to escalate to a manager. Over time, they find that the more empowered their staff feel, the higher their customer satisfaction scores and repeat business.
Connection Metrics measures the emotional connection between customers and the brand.
- It shows how well the brand is resonating with customers on a personal level
- It can lead to stronger brand loyalty and advocacy
Example: A clothing retailer measures connection metrics by tracking customer engagement with their social media content and email newsletters. Over time, they find that the more they are able to connect with customers on a personal level, the more loyal their customers become and the more likely they are to recommend the brand to others.
It’s been found that that gather input from their customers tend to have more positive reviews than negative reviews.
Source: blog.smile
Conclusion
Customer engagement metrics are one of the most important sources of marketing data. They provide insight into what tactics and channels are working, what’s not working at all, and when customers need your service the most. Conversions are never guaranteed; you can only increase your chances of making a sale by keeping an eye on customer engagement metrics.